| .. | ||
| lv_demo_benchmark.c | ||
| lv_demo_benchmark.h | ||
| README.md | ||
| screenshot1.png | ||
| screenshot2.png | ||
Benchmark demo
Overview
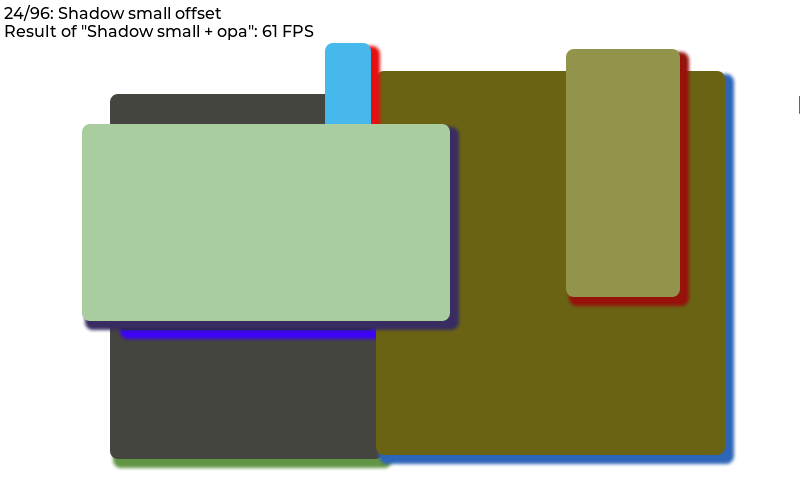
The benchmark demo tests the performance in various cases. For example rectangle, border, shadow, text, image blending, image transformation, bleding modes, etc. All tests are repeated with 50% opacity.
The size an position of the objects during testing are set with a pseudo random number to make the benchmark repeatable.
On to top of the screen the title of the current test step, and the result of the previous step is displayed.
Run the benchmark
- In
lv_ex_conf.hsetLV_USE_DEMO_BENCHMARK 1 - After
lv_init()and initializing the drivers calllv_demo_benchmark()
Interpret the result
The FPS is measured like this:
- load the next step
- in the display driver's
monitor_cbaccumulate the time-to-render and the number of cycles - measure for 1 second
- calculate
FPS = time_sum / render_cnt
Note that it can result in very high FPS results for simple cases.
E.g. if some simple rectangles are drawn in 5 ms, the benchmark will tell it's 200 FPS.
So it ignores LV_DISP_REFR_PERIOD which tells LVGL how often it should refresh the screen.
In other words, the benchmark shows the FPS from the pure rendering time.
By default, only the changed areas are refreshed. It means if only a few pixels are changed in 1 ms the benchmark will show 1000 FPS. To measure the performance with full screen refresh uncomment lv_obj_invalidate(lv_scr_act()) in monitor_cb() in lv_demo_benchmark.c.
Result summary
In the end, a table is created to display measured FPS values.
On top of the summary screen, the "Weighted FPS" value is shown. In this, the result of the more common cases are taken into account with a higher weight.
"Opa. speed" shows the speed of the measurements with opacity compared to full opacity. E.g. "Opa. speed = 90%" means that rendering with opacity is 10% slower.
In the first section of the table, "Slow but common cases", those cases are displayed which are considered common but were slower than 20 FPS.
Below this in the "All cases section" all the results are shown. The < 10 FPS results are shown with red, the >= 10 but < 20 FPS values are displayed with orange.
